%matplotlib inline
Plot features in adata.obsm
This example shows how to use squidpy.pl.extract to plot features in
anndata.AnnData.obsm.
See also
See {doc}`examples/image/compute_summary_features` for
computing an example of such features.
import squidpy as sq

adata = sq.datasets.slideseqv2()
adata
AnnData object with n_obs × n_vars = 41786 × 4000
    obs: 'barcode', 'x', 'y', 'n_genes_by_counts', 'log1p_n_genes_by_counts', 'total_counts', 'log1p_total_counts', 'pct_counts_in_top_50_genes', 'pct_counts_in_top_100_genes', 'pct_counts_in_top_200_genes', 'pct_counts_in_top_500_genes', 'total_counts_MT', 'log1p_total_counts_MT', 'pct_counts_MT', 'n_counts', 'leiden', 'cluster'
    var: 'MT', 'n_cells_by_counts', 'mean_counts', 'log1p_mean_counts', 'pct_dropout_by_counts', 'total_counts', 'log1p_total_counts', 'n_cells', 'highly_variable', 'highly_variable_rank', 'means', 'variances', 'variances_norm'
    uns: 'cluster_colors', 'hvg', 'leiden', 'leiden_colors', 'neighbors', 'pca', 'spatial_neighbors', 'umap'
    obsm: 'X_pca', 'X_umap', 'deconvolution_results', 'spatial'
    varm: 'PCs'
    obsp: 'connectivities', 'distances', 'spatial_connectivities', 'spatial_distances'
In this dataset, we have saved deconvolution results in
anndata.AnnData.obsm and we would like to plot them with
squidpy.pl.spatial_scatter.
adata.obsm["deconvolution_results"].head(10)
| Interneurons | Subiculum_Entorhinal_cl2 | Subiculum_Entorhinal_cl3 | DentatePyramids | CA1_CA2_CA3_Subiculum | Mural | Astrocytes | Oligodendrocytes | Polydendrocytes | Microglia | Ependymal | Endothelial_Tip | Neurogenesis | Endothelial_Stalk | barcode | max_cell_type | maxval | thresh_ct | |
|---|---|---|---|---|---|---|---|---|---|---|---|---|---|---|---|---|---|---|
| AACGTCATAATCGT | 0.113249 | 0.203010 | 0.086060 | 0.247319 | 0.153769 | 0.002455 | 0.072134 | 0.022327 | 0.008712 | 0.065562 | 0.003853 | 0.000000 | 0.000000 | 0.021550 | AACGTCATAATCGT | 4 | 0.247319 | 0.000000 |
| TACTTTAGCGCAGT | 0.055718 | 0.077973 | 0.048517 | 0.187755 | 0.195889 | 0.040198 | 0.126317 | 0.071605 | 0.052353 | 0.013668 | 0.016075 | 0.044060 | 0.012159 | 0.057714 | TACTTTAGCGCAGT | 5 | 0.195889 | 0.000000 |
| CATGCCTGGGTTCG | 0.108751 | 0.228845 | 0.109581 | 0.246070 | 0.115723 | 0.006306 | 0.071186 | 0.015768 | 0.000000 | 0.059735 | 0.000000 | 0.013702 | 0.000000 | 0.024332 | CATGCCTGGGTTCG | 4 | 0.246070 | 0.000000 |
| TCGATATGGCACAA | 0.108163 | 0.029694 | 0.112905 | 0.172960 | 0.122573 | 0.014295 | 0.065901 | 0.031834 | 0.096153 | 0.034155 | 0.094124 | 0.065322 | 0.011114 | 0.040808 | TCGATATGGCACAA | 4 | 0.172960 | 0.000000 |
| TTATCTGACGAAGC | 0.065790 | 0.236463 | 0.012458 | 0.233441 | 0.145091 | 0.014810 | 0.097935 | 0.052590 | 0.023642 | 0.008578 | 0.014275 | 0.058715 | 0.000000 | 0.036213 | TTATCTGACGAAGC | 2 | 0.236463 | 0.000000 |
| GATGCGACTCCTCG | 0.000000 | 0.000000 | 0.000000 | 0.222606 | 0.705572 | 0.042319 | 0.009459 | 0.000000 | 0.002753 | 0.009457 | 0.000000 | 0.000000 | 0.004932 | 0.002902 | GATGCGACTCCTCG | 5 | 0.705572 | 0.705572 |
| ACGGATGTTCCGAT | 0.000000 | 0.000000 | 0.000000 | 0.037305 | 0.078873 | 0.014507 | 0.032262 | 0.500225 | 0.099139 | 0.147571 | 0.013209 | 0.023574 | 0.010208 | 0.043127 | ACGGATGTTCCGAT | 8 | 0.500225 | 0.500225 |
| TCTCATGGGTGGGA | 0.011898 | 0.000000 | 0.000000 | 0.114613 | 0.089905 | 0.010118 | 0.411598 | 0.188769 | 0.034367 | 0.059139 | 0.000000 | 0.029453 | 0.017615 | 0.032526 | TCTCATGGGTGGGA | 7 | 0.411598 | 0.411598 |
| ACCGGAACTTCTTC | 0.016862 | 0.000000 | 0.000000 | 0.017110 | 0.070573 | 0.017013 | 0.006445 | 0.091637 | 0.034633 | 0.022682 | 0.659986 | 0.029675 | 0.009862 | 0.023523 | ACCGGAACTTCTTC | 11 | 0.659986 | 0.659986 |
| ACAGGGTTTATCGA | 0.012235 | 0.000000 | 0.010678 | 0.138919 | 0.723275 | 0.026109 | 0.029469 | 0.003275 | 0.003829 | 0.011391 | 0.011063 | 0.000000 | 0.014785 | 0.014970 | ACAGGGTTTATCGA | 5 | 0.723275 | 0.723275 |
Squidpy provides an easy wrapper that creates a temporary copy of the
feature matrix and pass it to anndata.AnnData.obs.
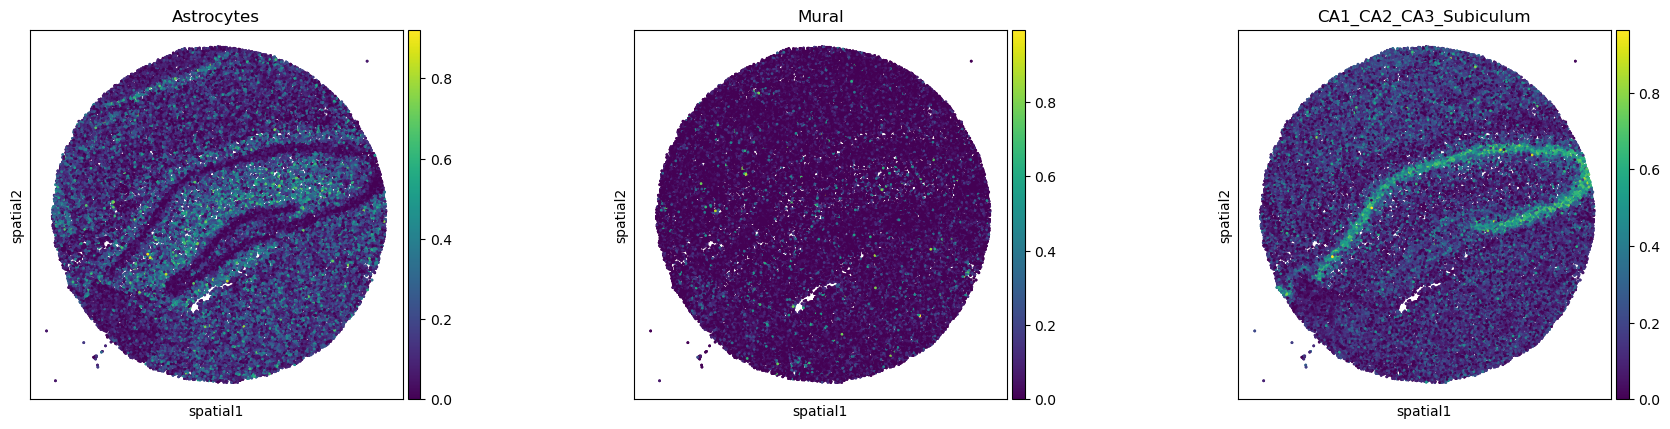
sq.pl.spatial_scatter(
    sq.pl.extract(adata, "deconvolution_results"),
    shape=None,
    color=["Astrocytes", "Mural", "CA1_CA2_CA3_Subiculum"],
    size=4,
)
WARNING: Overwriting `adata.obs['barcode']`
WARNING: Please specify a valid `library_id` or set it permanently in {attr}`adata.uns['spatial']`