%matplotlib inline
Extract summary features
This example shows how to extract summary features from the tissue image.
Summary features give a good overview over the intensity of each image
channels at the location of the Visium spots. They are calculated by
using features = 'summary', which calls
squidpy.im.ImageContainer.features_summary().
In addition to feature_name and channels we can specify the
following features_kwargs:
quantiles- quantiles that are computed. By default, the 0.9th, 0.5th, and 0.1th quantiles are calculated.
See also
See {doc}`compute_features` for general usage
of {func}`squidpy.im.calculate_image_features`.
import squidpy as sq
First, let’s load the fluorescence Visium dataset.
# get spatial dataset including hires tissue image
img = sq.datasets.visium_fluo_image_crop()
adata = sq.datasets.visium_fluo_adata_crop()
Then, we calculate the 0.1th quantile, mean and standard deviation for
the Visium spots of the fluorescence channels 0 (DAPI) and 1 (GFAP). In
order to get statistics of only the tissue underneath the spots, we use
the argument mask_circle = True. When not setting this flag,
statistics are calculated using a square crop centered on the spot.
# calculate summary features and save in key "summary_features"
sq.im.calculate_image_features(
    adata,
    img,
    features="summary",
    features_kwargs={
        "summary": {
            "quantiles": [0.1],
            "channels": [0, 1],
        }
    },
    key_added="summary_features",
    mask_circle=True,
    show_progress_bar=False,
)
The result is stored in anndata.AnnData.obsm\ ['summary_features'].
adata.obsm["summary_features"].head()
| summary_ch-0_quantile-0.1 | summary_ch-0_mean | summary_ch-0_std | summary_ch-1_quantile-0.1 | summary_ch-1_mean | summary_ch-1_std | |
|---|---|---|---|---|---|---|
| AAACGAGACGGTTGAT-1 | 0.0 | 6849.760120 | 14383.136990 | 0.0 | 3762.582691 | 2462.922155 |
| AAAGGGATGTAGCAAG-1 | 0.0 | 4469.448519 | 11304.932832 | 0.0 | 3824.862145 | 2153.804234 |
| AAATGGCATGTCTTGT-1 | 0.0 | 5944.567897 | 9808.327041 | 0.0 | 5481.824787 | 6747.728831 |
| AAATGGTCAATGTGCC-1 | 0.0 | 5259.799257 | 9115.113451 | 0.0 | 2628.194501 | 1418.504292 |
| AAATTAACGGGTAGCT-1 | 0.0 | 4468.428701 | 10285.605481 | 0.0 | 4036.154302 | 4447.304626 |
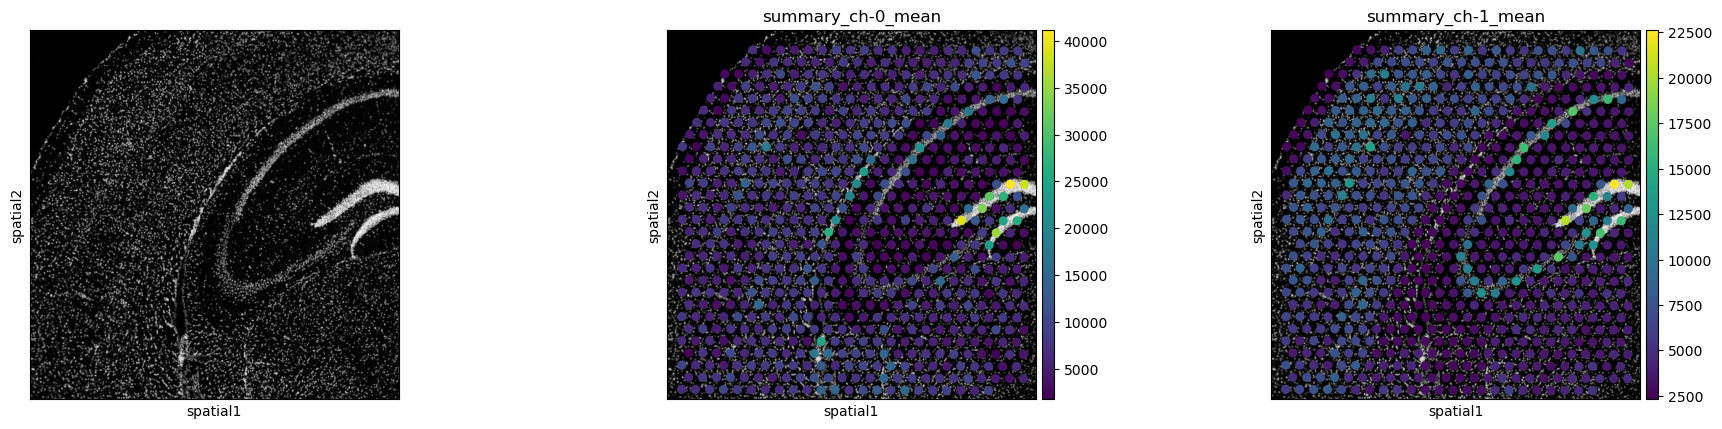
Use squidpy.pl.extract to plot the summary features on the tissue
image or have a look at napari-spatialdata for interactive visualization. Note how the spatial distribution of
channel means is different for fluorescence channels 0 (DAPI stain) and
1 (GFAP stain).
sq.pl.spatial_scatter(
    sq.pl.extract(adata, "summary_features"),
    color=[None, "summary_ch-0_mean", "summary_ch-1_mean"],
    img_cmap="gray",
)