%matplotlib inline
Cell-segmentation for fluorescence images
This example shows how to use the high resolution tissue images to segment nuclei.
This information can be used to compute additional image features like
cell count and cell size per spot (see
examples_image_compute_segmentation_features). This
example shows how to use squidpy.im.segment and explains the
parameters you can use.
We provide a built-in segmentation model
squidpy.im.SegmentationWatershed. In addition, you can use a custom
segmentation function, like a pre-trained tensorflow.keras model, to
perform the segmentation utilizing squidpy.im.SegmentationCustom.
Note that when using the provided segmentation model [‘watershed’]{.title-ref}, the quality of the cell-segmentation depends on the quality of your tissue images. In this example we use the DAPI stain of a fluorescence dataset to compute the segmentation. For harder cases, you may want to provide your own pre-trained segmentation model.
See also
examples_image_compute_segment_hnefor an example on how to calculate a cell-segmentation of an H&E stain.Nuclei Segmentation using Cellpose for a tutorial on using Cellpose as a custom segmentation function.
Nuclei Segmentation using StarDist for a tutorial on using StarDist as a custom segmentation function.
import numpy as np

import matplotlib.pyplot as plt

import squidpy as sq

# load fluorescence tissue image
img = sq.datasets.visium_fluo_image_crop()
We crop the image to a smaller segment. This is only to speed things up,
squidpy.im.segment can also process very large images (see
examples_image_compute_process_hires).
crop = img.crop_corner(1000, 1000, size=1000)
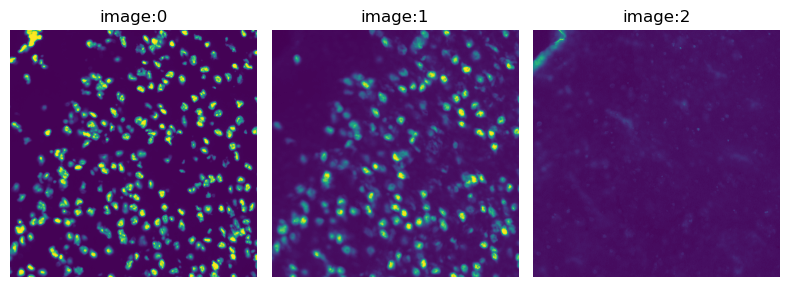
The tissue image in this dataset contains four fluorescence stains. The first one is DAPI, which we will use for the nuclei-segmentation.
crop.show("image", channelwise=True)
We segment the image with squidpy.im.segment using watershed
segmentation (method = 'watershed'). With the arguments layer and
channel we define the image layer and channel of the image that should
be segmented.
With kwargs we can provide keyword arguments to the segmentation
model. For watershed segmentation, we need to set a threshold to create
the mask image. You can either set a manual threshold, or use automated
Otsu thresholding. For
this fluorescence image example, Otsu’s thresh works very well, thus we
will use thresh = None. See
examples_image_compute_segment_hne for an example
where we use a manually defined threshold.
In addition, we can specify if the values greater or equal than the
threshold should be in the mask (default) or if the values smaller to
the threshold should be in the mask (geq = False).
sq.im.segment(
    img=crop, layer="image", channel=0, method="watershed", thresh=None, geq=True
)
The segmented crop is saved in the layer segmented_watershed. This
behavior can be changed with the arguments copy and layer_added. The
result of the segmentation is a label image that can be used to extract
features like the number of cells from the image.
print(crop)
print(f"Number of segments in crop: {len(np.unique(crop['segmented_watershed']))}")
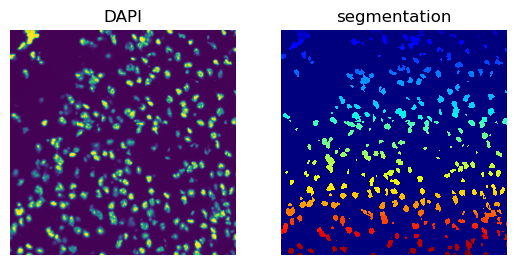
fig, axes = plt.subplots(1, 2)
crop.show("image", channel=0, ax=axes[0])
_ = axes[0].set_title("DAPI")
crop.show("segmented_watershed", cmap="jet", interpolation="none", ax=axes[1])
_ = axes[1].set_title("segmentation")
ImageContainer[shape=(1000, 1000), layers=['image', 'segmented_watershed']]
Number of segments in crop: 580