%matplotlib inline
Extract histogram features
This example shows how to extract histogram features from tissue image.
Histogram features give a more detailed view than summary features
(examples_image_compute_summary_features) by
computing a histogram of each image channel and returning bin-counts for
each Visium spot.
In addition to feature_name and channels we can specify the
following features_kwargs:
bins- number of bins of the histogram, default is 10.
v_range- range on which values are binned, default is the whole image range.
See also
See {doc}`compute_features` for general usage
of {func}`squidpy.im.calculate_image_features`.
import squidpy as sq
Lets load the fluorescence Visium dataset and calculate bin-counts (3 bins) of channels 0 and 1.
# get spatial dataset including high-resolution tissue image
img = sq.datasets.visium_fluo_image_crop()
adata = sq.datasets.visium_fluo_adata_crop()

# calculate histogram features and save in key "histogram_features"
sq.im.calculate_image_features(
    adata,
    img,
    features="histogram",
    features_kwargs={"histogram": {"bins": 3, "channels": [0, 1]}},
    key_added="histogram_features",
)
The result is stored in anndata.AnnData.obsm\ ['histogram_features'].
adata.obsm["histogram_features"].head()
| histogram_ch-0_bin-0 | histogram_ch-0_bin-1 | histogram_ch-0_bin-2 | histogram_ch-1_bin-0 | histogram_ch-1_bin-1 | histogram_ch-1_bin-2 | |
|---|---|---|---|---|---|---|
| AAACGAGACGGTTGAT-1 | 28201 | 1649 | 2191 | 32041 | 0 | 0 |
| AAAGGGATGTAGCAAG-1 | 30072 | 748 | 1221 | 31510 | 529 | 2 |
| AAATGGCATGTCTTGT-1 | 29032 | 2252 | 757 | 30793 | 1002 | 246 |
| AAATGGTCAATGTGCC-1 | 28672 | 2411 | 958 | 32041 | 0 | 0 |
| AAATTAACGGGTAGCT-1 | 29996 | 1116 | 929 | 31367 | 674 | 0 |
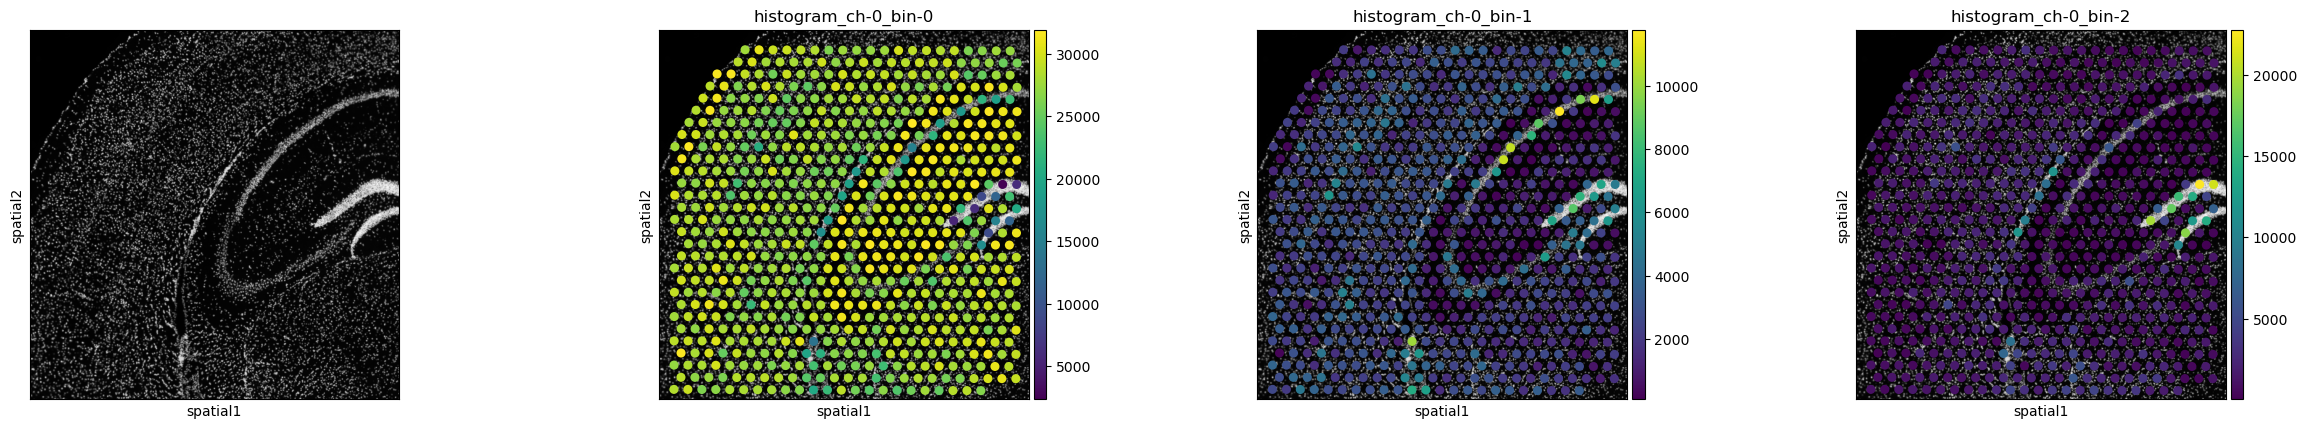
Use squidpy.pl.extract to plot the histogram features on the tissue
image or have a look at napari-spatialdata for interactive visualization. With these features we can e.g. appreciate
the detailed distribution of intensity values of channel 0 (DAPI stain)
on the different bins.
sq.pl.spatial_scatter(
    sq.pl.extract(adata, "histogram_features"),
    color=[
        None,
        "histogram_ch-0_bin-0",
        "histogram_ch-0_bin-1",
        "histogram_ch-0_bin-2",
    ],
    img_cmap="gray",
)