%matplotlib inline
Receptor-ligand analysis
This example shows how to run the receptor-ligand analysis.
It uses an efficient re-implementation of the cellphonedb algorithm
which can handle large number of interacting pairs (100k+) and cluster
combinations (100+).
See also
See Neighbors enrichment analysis for
finding cluster neighborhood with squidpy.gr.nhood_enrichment().
import squidpy as sq

adata = sq.datasets.seqfish()
adata
AnnData object with n_obs × n_vars = 19416 × 351
    obs: 'Area', 'celltype_mapped_refined'
    uns: 'celltype_mapped_refined_colors'
    obsm: 'X_umap', 'spatial'
To get started, we just need an anndata.AnnData object with some
clustering information. Below are some useful parameters of
squidpy.gr.ligrec:
n_perms- number of permutations for the permutation test.
interactions- list of interaction, by default we fetch all available interactions fromomnipath.
{interactions,transmitter,receiver}_params- parameters used if downloading theinteractions, seeomnipah.interactions.import_intercell_networkfor more information.
threshold- percentage of cells required to be expressed in a given cluster.
corr_method- false discovery rate (FDR) correction method to use.
Since we’re interested in receptors and ligands in this example, we
specify these categories in receiver_params and transmitter_params,
respectively. If desired, we can also restrict the resources to just a
select few. For example, in order to only use cellphonedb, set
interactions_params={'resources': 'CellPhoneDB'}.
res = sq.gr.ligrec(
    adata,
    n_perms=1000,
    cluster_key="celltype_mapped_refined",
    copy=True,
    use_raw=False,
    transmitter_params={"categories": "ligand"},
    receiver_params={"categories": "receptor"},
)
First, we inspect the calculated means. The resulting object is a
pandas.DataFrame, with rows corresponding to interacting pairs and
columns to cluster combinations.
res["means"].head()
| cluster_1 | Allantois | ... | Surface ectoderm | |||||||||||||||||||
|---|---|---|---|---|---|---|---|---|---|---|---|---|---|---|---|---|---|---|---|---|---|---|
| cluster_2 | Allantois | Anterior somitic tissues | Cardiomyocytes | Cranial mesoderm | Definitive endoderm | Dermomyotome | Endothelium | Erythroid | Forebrain/Midbrain/Hindbrain | Gut tube | ... | Lateral plate mesoderm | Low quality | Mixed mesenchymal mesoderm | NMP | Neural crest | Presomitic mesoderm | Sclerotome | Spinal cord | Splanchnic mesoderm | Surface ectoderm | |
| source | target | |||||||||||||||||||||
| KDR | PECAM1 | 0.142857 | 0.294237 | 0.150901 | 0.233090 | 0.183007 | 0.187666 | 1.475811 | 0.214416 | 0.160415 | 0.190973 | ... | 0.271419 | 0.302056 | 0.277021 | 0.254229 | 0.318590 | 0.274281 | 0.287045 | 0.242653 | 0.235369 | 0.276529 |
| IGF1 | KDR | 0.162338 | 0.484172 | 0.250242 | 0.232278 | 0.164777 | 0.246182 | 2.253158 | 0.192922 | 0.141502 | 0.169111 | ... | 0.327692 | 0.292735 | 0.289093 | 0.230291 | 0.306367 | 0.368467 | 0.286925 | 0.251546 | 0.270060 | 0.323970 |
| PDGFA | KDR | 0.240260 | 0.562094 | 0.328164 | 0.310200 | 0.242699 | 0.324104 | 2.331080 | 0.270844 | 0.219424 | 0.247033 | ... | 1.748416 | 1.713459 | 1.709817 | 1.651015 | 1.727091 | 1.789191 | 1.707649 | 1.672270 | 1.690784 | 1.744694 |
| NRP1 | KDR | 0.532468 | 0.854302 | 0.620372 | 0.602408 | 0.534906 | 0.616312 | 2.623288 | 0.563052 | 0.511632 | 0.539240 | ... | 0.558029 | 0.523072 | 0.519430 | 0.460628 | 0.536704 | 0.598804 | 0.517262 | 0.481883 | 0.500397 | 0.554307 |
| FGF3 | FGFR3 | 0.324675 | 0.162744 | 0.288913 | 0.216180 | 0.467593 | 0.204117 | 0.191248 | 0.139589 | 0.705757 | 0.270203 | ... | 0.255896 | 0.234674 | 0.632132 | 0.557881 | 0.299989 | 0.268179 | 0.268655 | 0.478236 | 0.385616 | 0.393883 |
5 rows × 484 columns
Next, we take a look at the p-values. If corr_method != None, this
will contained the corrected p-values. The p-values marked as
[NaN]{.title-ref} correspond to interactions, which did not pass the
filtering threshold specified above.
res["pvalues"].head()
| cluster_1 | Allantois | ... | Surface ectoderm | |||||||||||||||||||
|---|---|---|---|---|---|---|---|---|---|---|---|---|---|---|---|---|---|---|---|---|---|---|
| cluster_2 | Allantois | Anterior somitic tissues | Cardiomyocytes | Cranial mesoderm | Definitive endoderm | Dermomyotome | Endothelium | Erythroid | Forebrain/Midbrain/Hindbrain | Gut tube | ... | Lateral plate mesoderm | Low quality | Mixed mesenchymal mesoderm | NMP | Neural crest | Presomitic mesoderm | Sclerotome | Spinal cord | Splanchnic mesoderm | Surface ectoderm | |
| source | target | |||||||||||||||||||||
| KDR | PECAM1 | 1.000 | 0.941 | 1.000 | 0.999 | 1.000 | 1.00 | 0.0 | 1.000 | 1.000 | 1.000 | ... | 1.000 | 1.0 | 1.0 | 1.000 | 1.0 | 1.000 | 0.999 | 1.0 | 1.000 | 1.000 |
| IGF1 | KDR | 1.000 | 0.131 | 0.999 | 1.000 | 1.000 | 1.00 | 0.0 | 1.000 | 1.000 | 1.000 | ... | 0.996 | 1.0 | 1.0 | 0.996 | 1.0 | 0.745 | 0.910 | 1.0 | 1.000 | 0.990 |
| PDGFA | KDR | 1.000 | 0.321 | 0.999 | 0.999 | 1.000 | 1.00 | 0.0 | 1.000 | 1.000 | 1.000 | ... | 0.000 | 0.0 | 0.0 | 0.000 | 0.0 | 0.000 | 0.000 | 0.0 | 0.000 | 0.000 |
| NRP1 | KDR | 0.909 | 0.074 | 0.823 | 0.885 | 0.967 | 0.83 | 0.0 | 0.939 | 0.993 | 0.975 | ... | 1.000 | 1.0 | 1.0 | 1.000 | 1.0 | 0.992 | 0.991 | 1.0 | 1.000 | 1.000 |
| FGF3 | FGFR3 | 0.767 | 1.000 | 1.000 | 1.000 | 0.076 | 1.00 | 1.0 | 1.000 | 0.000 | 1.000 | ... | 1.000 | 1.0 | 0.0 | 0.004 | 1.0 | 1.000 | 0.975 | 0.0 | 0.608 | 0.389 |
5 rows × 484 columns
Any interaction metadata downloaded from omnipath, such as the
interaction type, can be accessed as:
res["metadata"].head()
| aspect_intercell_source | aspect_intercell_target | category_intercell_source | category_intercell_target | category_source_intercell_source | category_source_intercell_target | consensus_direction | consensus_inhibition | consensus_score_intercell_source | consensus_score_intercell_target | ... | scope_intercell_source | scope_intercell_target | secreted_intercell_source | secreted_intercell_target | sources | transmitter_intercell_source | transmitter_intercell_target | type | uniprot_intercell_source | uniprot_intercell_target | ||
|---|---|---|---|---|---|---|---|---|---|---|---|---|---|---|---|---|---|---|---|---|---|---|
| source | target | |||||||||||||||||||||
| KDR | PECAM1 | functional | functional | ligand | receptor | resource_specific | resource_specific | True | False | 1 | 10 | ... | generic | generic | True | False | Wang | True | False | post_translational | P35968 | P16284 |
| IGF1 | KDR | functional | functional | ligand | receptor | resource_specific | resource_specific | True | False | 19 | 23 | ... | generic | generic | True | True | Wang | True | False | post_translational | P05019 | P35968 |
| PDGFA | KDR | functional | functional | ligand | receptor | resource_specific | resource_specific | True | False | 18 | 23 | ... | generic | generic | True | True | Wang | True | False | post_translational | P04085 | P35968 |
| NRP1 | KDR | functional | functional | ligand | receptor | resource_specific | resource_specific | True | False | 2 | 23 | ... | generic | generic | True | True | BioGRID;CellChatDB-cofactors;HPRD;Wang | True | False | post_translational | O14786 | P35968 |
| FGF3 | FGFR3 | functional | functional | ligand | receptor | resource_specific | resource_specific | False | False | 17 | 19 | ... | generic | generic | True | True | Baccin2019;CellCall;CellPhoneDB;CellTalkDB;Cel... | True | False | post_translational | P11487 | P22607 |
5 rows × 41 columns
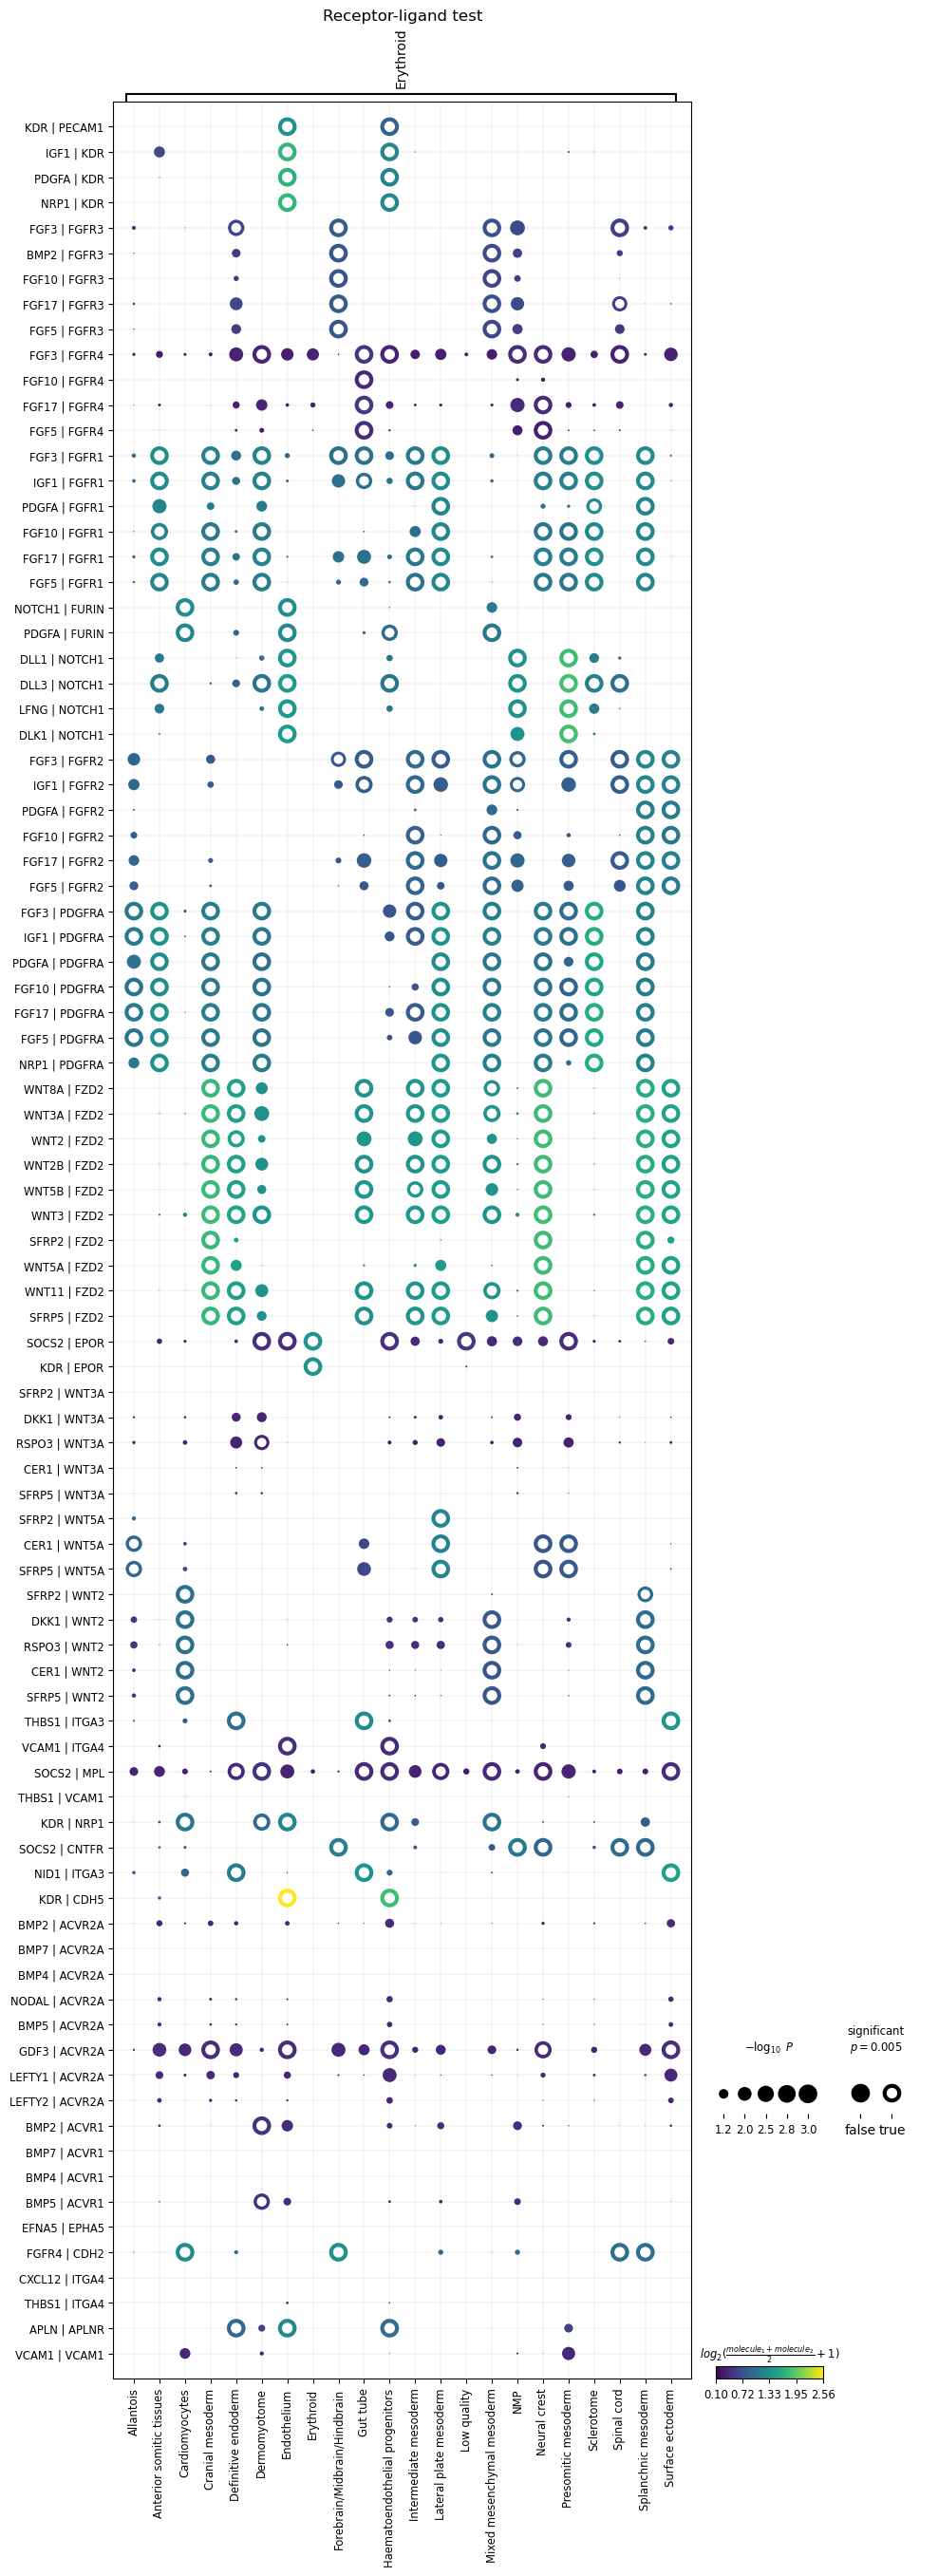
In order to plot the results, we can run squidpy.pl.ligrec. Some
useful parameters are:
{source,target}_groups- only plot specific source/target clusters.
dendrogram- whether to hierarchically cluster the rows, columns or both.
mean_range- plot only interactions whose means are in this range.
pval_threshold- plot only interactions whose p-values are below this threshold.
In the plot below, to highlight significance, we’ve marked all p-values <= 0.005 with tori.
sq.pl.ligrec(res, source_groups="Erythroid", alpha=0.005)