%matplotlib inline
Compute interaction matrix
This example shows how to compute the interaction matrix.
The interaction matrix quantifies the number of edges that nodes belonging to a given annotation shares with the other annotations. It’s a descriptive statistics of the spatial graph.
See also
See {doc}`compute_spatial_neighbors` for general usage of
{func}`squidpy.gr.spatial_neighbors`.
import squidpy as sq

adata = sq.datasets.imc()
adata
AnnData object with n_obs × n_vars = 4668 × 34
    obs: 'cell type'
    uns: 'cell type_colors'
    obsm: 'spatial'
First, we need to compute a connectivity matrix from spatial coordinates. We can use
squidpy.gr.spatial_neighbors() for this purpose.
sq.gr.spatial_neighbors(adata)
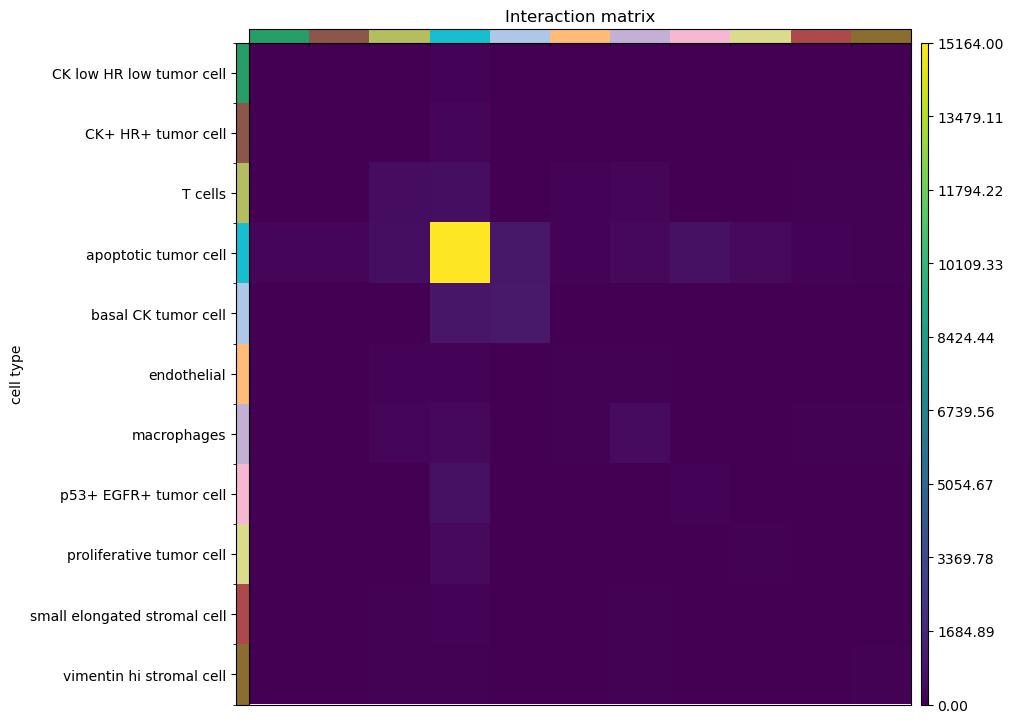
We can compute the interaction matrix with squidpy.gr.interaction_matrix(). Specify normalized = True
if you want a row-normalized matrix. Results can be visualized with squidpy.pl.interaction_matrix().
sq.gr.interaction_matrix(adata, cluster_key="cell type")
sq.pl.interaction_matrix(adata, cluster_key="cell type")