%matplotlib inline
Compute co-occurrence probability
This example shows how to compute the co-occurrence probability.
The co-occurrence score is defined as:
(1)\[\begin{align}\frac{p(exp|cond)}{p(exp)}\end{align}\]
where \(p(exp|cond)\) is the conditional probability of observing a cluster \(exp\) conditioned on the presence of a cluster \(cond\), whereas \(p(exp)\) is the probability of observing \(exp\) in the radius size of interest. The score is computed across increasing radii size around each cell in the tissue.
See also
See {doc}`graph/compute_ripley` for
another score to describe spatial patterns with {func}`squidpy.gr.ripley`.
import squidpy as sq

adata = sq.datasets.imc()
adata
AnnData object with n_obs × n_vars = 4668 × 34
    obs: 'cell type'
    uns: 'cell type_colors'
    obsm: 'spatial'
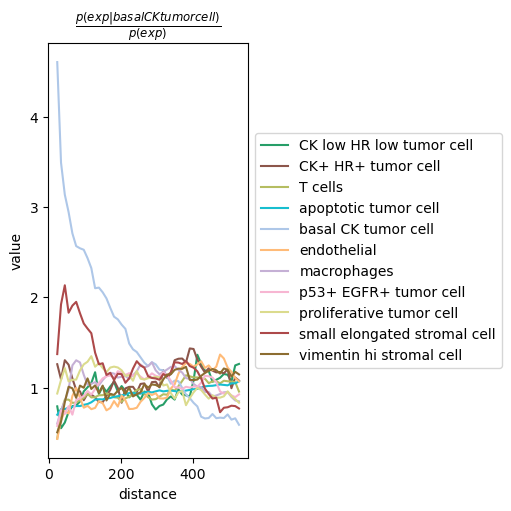
We can compute the co-occurrence score with squidpy.gr.co_occurrence().
Results can be visualized with squidpy.pl.co_occurrence().
sq.gr.co_occurrence(adata, cluster_key="cell type")
sq.pl.co_occurrence(adata, cluster_key="cell type", clusters="basal CK tumor cell")
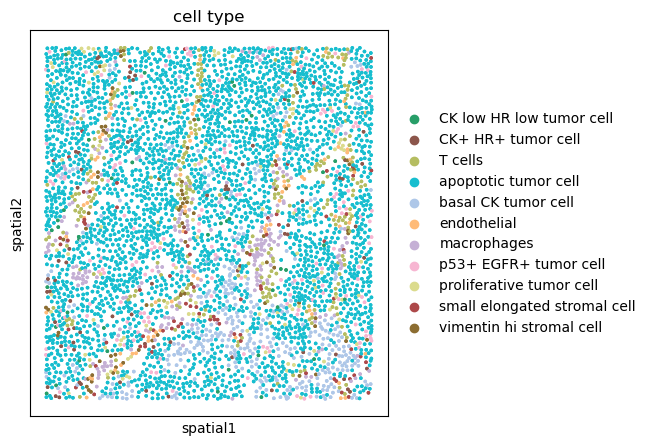
We can further visualize tissue organization in spatial coordinates with squidpy.pl.spatial_scatter().
sq.pl.spatial_scatter(adata, color="cell type", size=10, shape=None)
WARNING: Please specify a valid `library_id` or set it permanently in {attr}`adata.uns['spatial']`