%matplotlib inline
Compute centrality scores
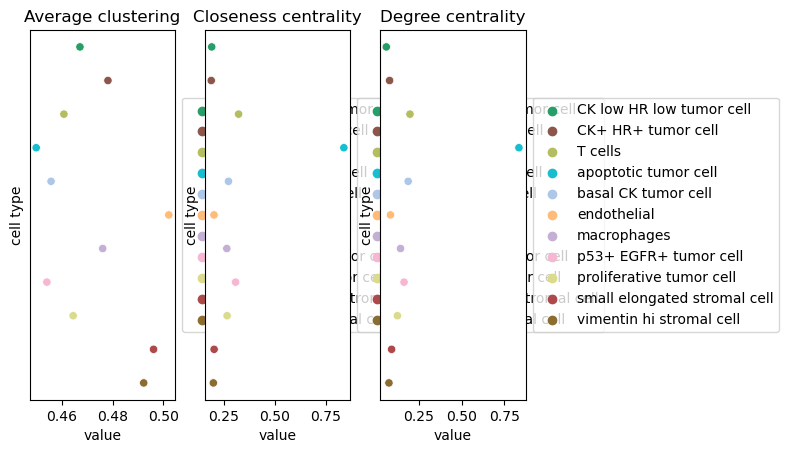
This example shows how to compute centrality scores, given a spatial graph and cell type annotation.
The scores calculated are closeness centrality, degree centrality and clustering coefficient with the following properties:
- closeness centrality - measure of how close the group is to other nodes.
- clustering coefficient - measure of the degree to which nodes cluster together.
- degree centrality - fraction of non-group members connected to group members.
All scores are descriptive statistics of the spatial graph.
See also
See {doc}`compute_spatial_neighbors` for general usage of
{func}`squidpy.gr.spatial_neighbors`.
import squidpy as sq

adata = sq.datasets.imc()
adata
AnnData object with n_obs × n_vars = 4668 × 34
    obs: 'cell type'
    uns: 'cell type_colors'
    obsm: 'spatial'
This dataset contains cell type annotations in anndata.AnnData.obs, which are used for calculation of
centrality scores. First, we need to compute a connectivity matrix from spatial coordinates. We can use
squidpy.gr.spatial_neighbors() for this purpose.
sq.gr.spatial_neighbors(adata)
Centrality scores are calculated with squidpy.gr.centrality_scores().
sq.gr.centrality_scores(adata, "cell type")
And visualize results with squidpy.pl.centrality_scores().
sq.pl.centrality_scores(adata, "cell type")