%matplotlib inline
Convert to grayscale using the apply method
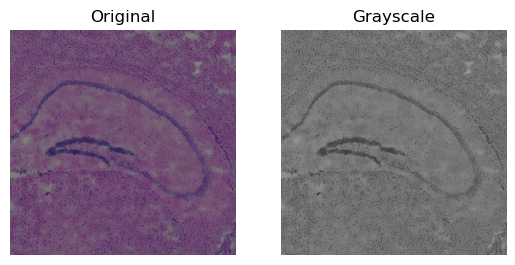
This example shows how to use squidpy.ImageContainer.apply to convert
an image layer to grayscale. This calls squidpy.im.process in the
background.
We take the mean of the three channels(RGB) using the user-defined
function `rgb2gray[ to convert the image to grayscale. The
function ]{.title-ref}rgb2gray[ computes the mean of the three
channels (RGB) across axis 3. The purpose of this example is to show how
the ]{.title-ref}apply[ method
{meth}`squidpy.ImageContainer.apply]{.title-ref} can be used.
import numpy as np

import matplotlib.pyplot as plt

import squidpy as sq
First, we load the H&E stained tissue image. Here, we only load a
cropped dataset to speed things up. In general,
squidpy.im.ImageContainer.apply() can also process very large images.
(See Process a high-resolution image).
img = sq.datasets.visium_hne_image_crop()
The method squidpy.im.ImageContainer.apply() takes a function as an
input. Such function, or a mapping of `{'{library_id}': function}[
takes a {class}`numpy.ndarray]{.title-ref} as input and returns an
image-like output. Here, the function takes `x``, which is a
numpy array as an input and returns the mean of three channels across
axis 3 and produces image-like output.
def rgb2gray(x):
    """Return the mean of numpy array along axis 3"""
    return np.mean(x, axis=3)
The H&E stained tissue image is an image layer of
squidpy.im.ImageContainer. So, we add .apply and pass the previously
defined function as an input.
gray = img.apply(rgb2gray)
Then, we convert the image to grayscale and plot the result, using matplotlib.
fig, axes = plt.subplots(1, 2)
img.show(ax=axes[0])
_ = axes[0].set_title("Original")
gray.show(cmap="gray", ax=axes[1])
_ = axes[1].set_title("Grayscale")
plt.show()