%matplotlib inline
Generate cropped images from spots
This example shows how to use
squidpy.im.ImageContainer.generate_spot_crops.
High-resolution tissue slides might be too large to fit in the memory.
Therefore, we use a generator that produces cropped images from the
original image container object.
squidpy.im.ImageContainer.generate_spot_crops iterates over
anndata.AnnData.obsm and extracts crops.
For Z-stacks, the specified library_id or list of library_id need to
match the name of the Z-dimension. Always extracts 2D crops from the
specified Z-dimension.
See also
- {doc}`compute_crops`
- {doc}`compute_process_hires`
- {doc}`compute_gray`
import matplotlib.pyplot as plt

import squidpy as sq
First, we load the H&E stained tissue image. Here, we only load a
cropped dataset to speed things up. In general,
squidpy.im.ImageContainer.generate_spot_crops can also process very
large images. See
Process a high-resolution image. Second, we load
the related anndata for the H&E stained tissue image.
img = sq.datasets.visium_hne_image_crop()
adata = sq.datasets.visium_hne_adata_crop()
Next, we use squidpy.im.ImageContainer.generate_spot_crops to make a
generator that generates cropped images. The argument as_array specify
the type in which the crop is returned. If we pass a specific layer in
the squidpy.im.ImageContainer then it will return a plain
numpy.ndarray. Check the documentation of the method
squidpy.im.ImageContainer.generate_spot_crops.
gen = img.generate_spot_crops(adata, scale=0.5, as_array="image", squeeze=True)
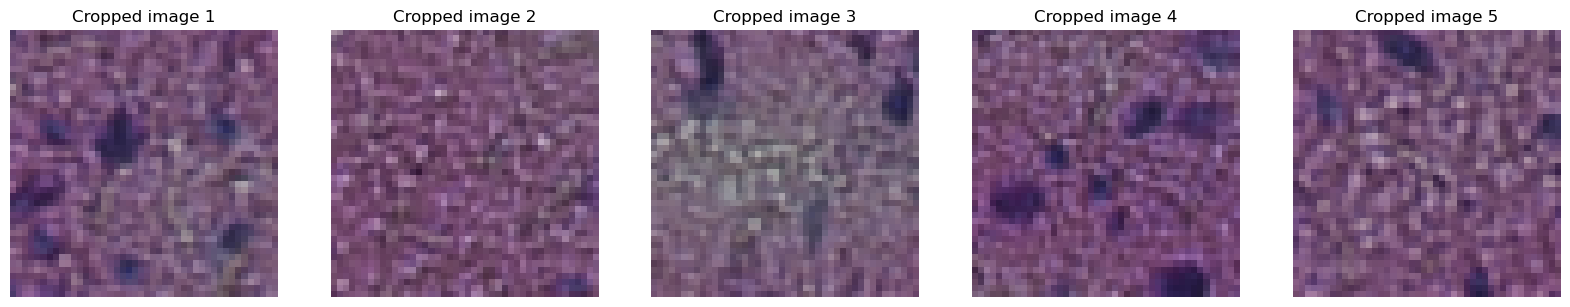
When called, the next(gen) produces consecutive cropped images each
time. Let’s plot the cropped images using matplotlib.
fig, axes = plt.subplots(1, 5)
fig.set_size_inches((20, 6))
for i in range(5):
    axes[i].set_title(f"Cropped image {i+1}")
    axes[i].axis("off")
    axes[i].imshow(next(gen))
We will now see how the cropped images differ with change in
spot_size. scale = 1 would crop the spot with exact diameter size.
You can crop larger area by increasing the scale. To illustrate this,
we change the spot_size and plot the images again by looping on
next(gen).
gen = img.generate_spot_crops(adata, scale=1.5, as_array="image", squeeze=True)
fig, axes = plt.subplots(1, 5)
fig.set_size_inches((20, 6))
for i in range(5):
    axes[i].set_title(f"Cropped spot {i}")
    axes[i].axis("off")
    axes[i].imshow(next(gen))
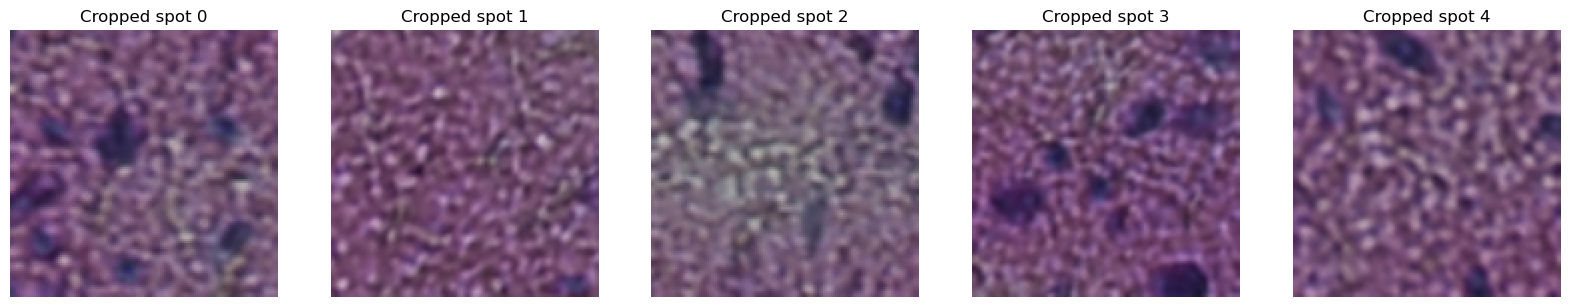
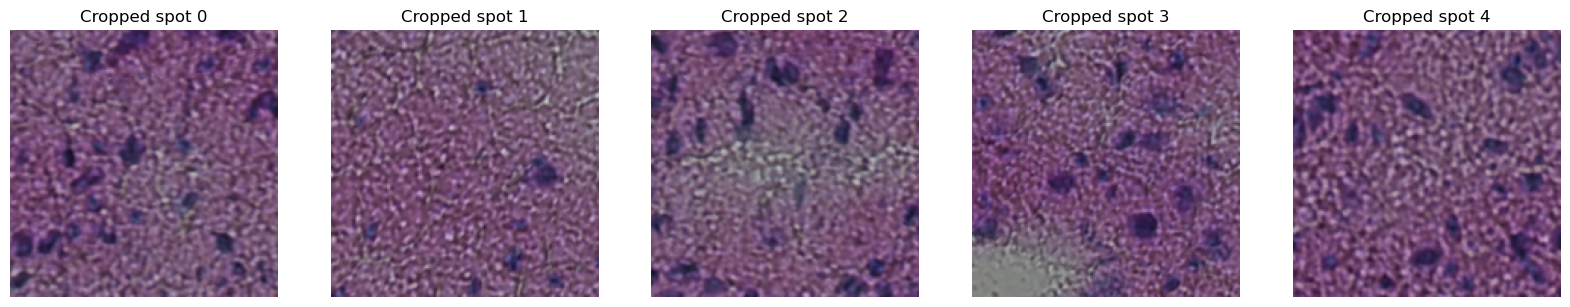
We can see the increase in the context with increase in the spot_size.
gen = img.generate_spot_crops(adata, spot_scale=2, as_array="image", squeeze=True)
fig, axes = plt.subplots(1, 5)
fig.set_size_inches((20, 6))
for i in range(5):
    axes[i].set_title(f"Cropped spot {i}")
    axes[i].axis("off")
    axes[i].imshow(next(gen))
Argument as_array also takes boolean True to return a dict where
the keys are layers and values are numpy.ndarray. In this case, there
is only one layer: 'image'
gen = img.generate_spot_crops(adata, spot_scale=0.5, as_array=True, squeeze=True)
dic = next(gen)
image = dic["image"]
plt.imshow(image)
<matplotlib.image.AxesImage at 0x1b7f81ca9d0>
Passing False to the argument as_array returns a
squidpy.im.ImageContainer.
gen = img.generate_spot_crops(adata, spot_scale=2, as_array=False, squeeze=True)
for _ in range(5):
    next(gen).show(figsize=(2, 2), dpi=40)


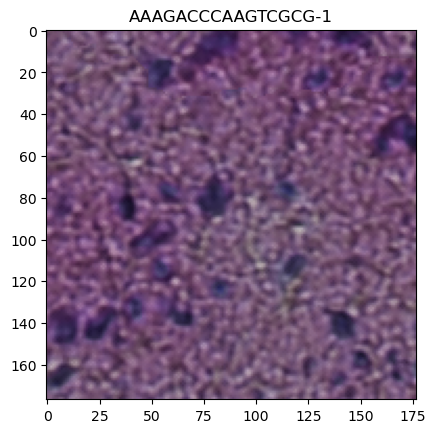
If return_obs = True, yields a tuple (cropped image, obs_name).
Otherwise, yields just the crops. The type of the crops depends on
as_array and the number of dimensions on squeeze. Such generator
could be used downstream in machine learning applications, where the
class label as well as the image is needed.
gen = img.generate_spot_crops(
    adata, spot_scale=2, as_array="image", squeeze=True, return_obs=True
)
image, obs_name = next(gen)
plt.imshow(image)
plt.title(obs_name)
Text(0.5, 1.0, 'AAAGACCCAAGTCGCG-1')