%matplotlib inline
Calculate distances to a user-defined anchor point
This example shows how to use squidpy.tl.var_by_distance() to calculate the minimum distances of all observations
to a user-defined anchor point, store the results in anndata.AnnData.obsm and plot the expression by distance.
using squidpy.pl.var_by_distance().
import squidpy as sq
First, let’s download the MIBI-TOF dataset.
adata = sq.datasets.mibitof()
This data set contains a cell type annotation in anndata.AnnData.obs\ ["Cluster"]
and a slide annotation in anndata.AnnData.obs\ ["library_id"]
adata.obs
| row_num | point | cell_id | X1 | center_rowcoord | center_colcoord | cell_size | category | donor | Cluster | batch | library_id | |
|---|---|---|---|---|---|---|---|---|---|---|---|---|
| 3034-0 | 3086 | 23 | 2 | 60316.0 | 269.0 | 7.0 | 408.0 | carcinoma | 21d7 | Epithelial | 0 | point23 |
| 3035-0 | 3087 | 23 | 3 | 60317.0 | 294.0 | 6.0 | 408.0 | carcinoma | 21d7 | Epithelial | 0 | point23 |
| 3036-0 | 3088 | 23 | 4 | 60318.0 | 338.0 | 4.0 | 304.0 | carcinoma | 21d7 | Imm_other | 0 | point23 |
| 3037-0 | 3089 | 23 | 6 | 60320.0 | 372.0 | 6.0 | 219.0 | carcinoma | 21d7 | Myeloid_CD11c | 0 | point23 |
| 3038-0 | 3090 | 23 | 8 | 60322.0 | 417.0 | 5.0 | 303.0 | carcinoma | 21d7 | Myeloid_CD11c | 0 | point23 |
| ... | ... | ... | ... | ... | ... | ... | ... | ... | ... | ... | ... | ... |
| 47342-2 | 48953 | 16 | 1103 | 2779.0 | 143.0 | 1016.0 | 283.0 | carcinoma | 90de | Fibroblast | 2 | point16 |
| 47343-2 | 48954 | 16 | 1104 | 2780.0 | 814.0 | 1017.0 | 147.0 | carcinoma | 90de | Fibroblast | 2 | point16 |
| 47344-2 | 48955 | 16 | 1105 | 2781.0 | 874.0 | 1018.0 | 142.0 | carcinoma | 90de | Imm_other | 2 | point16 |
| 47345-2 | 48956 | 16 | 1106 | 2782.0 | 257.0 | 1019.0 | 108.0 | carcinoma | 90de | Fibroblast | 2 | point16 |
| 47346-2 | 48957 | 16 | 1107 | 2783.0 | 533.0 | 1019.0 | 111.0 | carcinoma | 90de | Fibroblast | 2 | point16 |
3309 rows × 12 columns
For each slide we now want to calculate the distance of all observations to the closest Epithelial cell.
In addition we want to include the condition of the donors and the donor id in the resulting design matrix
As we don’t create a copy, the result will be stored in anndata.AnnData.obsm.
sq.tl.var_by_distance(
    adata=adata,
    groups="Epithelial",
    cluster_key="Cluster",
    library_key="library_id",
    covariates=["category", "donor"],
)
Since we didn’t specify a name, the resulting data frame is called “design_matrix”. NaN values indicate, that the observation belongs to an anchor point or that the coordinates for this observation weren’t available from the beginning on.
adata.obsm["design_matrix"]
| Cluster | library_id | Epithelial | Epithelial_raw | category | donor | |
|---|---|---|---|---|---|---|
| 3034-0 | Epithelial | point23 | NaN | 0.000000 | carcinoma | 21d7 |
| 3035-0 | Epithelial | point23 | NaN | 0.000000 | carcinoma | 21d7 |
| 3036-0 | Imm_other | point23 | 0.043157 | 33.105891 | carcinoma | 21d7 |
| 3037-0 | Myeloid_CD11c | point23 | 0.066190 | 50.774009 | carcinoma | 21d7 |
| 3038-0 | Myeloid_CD11c | point23 | 0.109999 | 84.380092 | carcinoma | 21d7 |
| ... | ... | ... | ... | ... | ... | ... |
| 47342-2 | Fibroblast | point16 | 0.849905 | 651.958588 | carcinoma | 90de |
| 47343-2 | Fibroblast | point16 | 0.418362 | 320.923667 | carcinoma | 90de |
| 47344-2 | Imm_other | point16 | 0.439758 | 337.336627 | carcinoma | 90de |
| 47345-2 | Fibroblast | point16 | 0.724977 | 556.126784 | carcinoma | 90de |
| 47346-2 | Fibroblast | point16 | 0.473780 | 363.435001 | carcinoma | 90de |
3309 rows × 6 columns
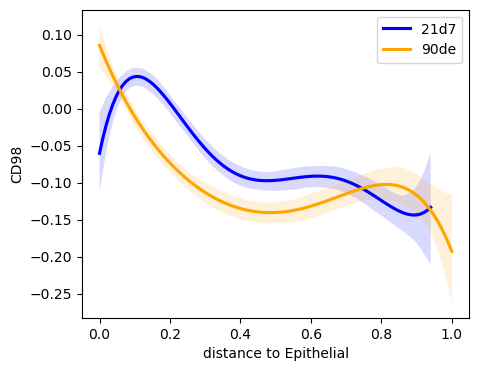
We now want to visualize the results and plot the expression of CD98 by distance to the closest Epithelial cell. In addition we want to differentiate between two expression trends by specifying a covariate.
sq.pl.var_by_distance(
    adata=adata,
    design_matrix_key="design_matrix",
    var="CD98",
    anchor_key="Epithelial",
    covariate="donor",
    line_palette=["blue", "orange"],
    show_scatter=False,
    figsize=(5, 4),
)